Open Science Repository Pharmaceutics
doi: 10.7392/Pharmaceutics.70081913
Influence of Antimycobacterial Agents on Renal Biochemical Parameters of Tuberculosis Patients
G.T. Abdoon [1], O. M. Elsheikh [2], E. A. Osman [2], A. A. Eljamal [2], G. Modawe [3], Mohiden A. Elmarouf [3], A. A. Omer [4], M. M. Dahab [2]
[1] Kassala University, Kassala, Sudan
[2] International University of Africa, Khartoum, Sudan
[3] Omdurman Islamic University, Faculty of Medicine, Department of Biochemistry
[4] National Ribat University-Faculty of Medicine
Abstract
Objectives
Studies on the relation between anti-tuberculosis drugs and proteins metabolites are numerous but, on the whole, desultory and inconclusive. The aim of this study was to investigate concentration of urea, creatinine and uric acid in the serum of Sudanese patients with tuberculosis before and after treatment.
Material and methods
A case-control of 200 Sudanese patients with tuberculosis was compared with 50 healthy subjects as control groups. A serum sample was taken and urea, creatinine and uric acid were analyzed using colorimetric methods.
Results
This study indicated that urea levels were significantly higher (P < 0.01) in serum of sputum negative before treatment and sputum positive TB patients after treatment with Streptomycin, Pyrazinamide, Rifampicin and Ethambutol. Serum creatinine was significantly higher (P < 0.01) for the TB patients before and after treatment compared to that of control, with exception of sputum positive patients who received Streptomycin, Pyrazinamide and Rifampicin. Uric acid in serum of sputum negative and sputum positive TB patients before treatment was significantly lower (P < 0.01) relative to that of healthy groups. However, its level was increased slightly after various treatments.
Conclusion
This study suggests an association between anti-tuberculosis drugs and levels of serum urea, creatinine and uric acid.
Keywords: tuberculosis, protein metabolites, anti-tuberculosis drug, Sudanese patients.
Citation: Abdoon, G. T., Elsheikh, O. M., Osman, E. A., Eljamal, A. A., Modawe, G., Elmarouf, M. A., Omer, A. A., et al. (2012). Influence of Antimycobacterial Agents on Renal Biochemical Parameters of Tuberculosis Patients. Open Science Repository Pharmaceutics, Online(open-access), e70081913. doi:10.7392/Pharmaceutics.70081913
Received: November 29, 2012
Published: December 18, 2012
Copyright: © 2012 Abdoon et al. Creative Commons Attribution 3.0 Unported License.
Contact: [email protected]
Introduction
Worldwide, Mycobacterium tuberculosis remains the leading infective cause of mortality and morbidity (Frieden et al., 2003). It is estimated that millions of new cases of active tuberculosis (TB) occur each year (Schluger et al., 1996). Treatment is with standard therapy of three or four drugs in the initial eight weeks. This initial period may contain Pyrazinamide as one of the agent (Bass et al., 1994). Many drugs used in the treatment of tuberculosis are known to stress the kidneys (Espinal et al., Fatal et al., 2000). Clearance of protein metabolites such as urea, creatinine and uric acid are of concern especially in certain circumstances where these drugs, essential for the treatment, tend to stress the kidneys. The clearance of uric acid varies in different conditions and it has been observed that tubular secretion of protein metabolites negatively correlated with body mass index (Mavromatidis et al., 2002). This study, therefore, aims to measure the protein metabolites urea, creatinine and uric acid in serum of tuberculosis patients before and after treatment with anti-tuberculosis drugs.
Materials and methods
Study population
This study included 200 Sudanese patients with pulmonary TB only from Kassala area. Their ages ranged between 20 to 80 years.
50 of them sputum negative that were infected by tuberculosis for the first time, diagnosed by X-ray and symptoms, treated with Streptomycin and Thiazine for two months. 50 sputum positive TB patients treated with Streptomycin, Pyrazinamide and Rifampicin for two months. 50 sputum positive TB patients treated by Thiazine for more than two months. Other 50 smear positive replaced TB patients treated with Pyrazinamide, Rifampicin, Ethambutol and Streptomycin for three months. 50 healthy subjects living in Kassala area, of similar ages, were used as control groups.
Sampling
Sputum samples were collected from each patient by coughing deeply into containers and were examined after staining according to the methods adopted by Glsony and Elchiawi (1991). Venous blood samples (5 ml) were collected from TB patients before and after treatments and once from control group. The blood samples were allowed to coagulate and centrifuged (at 300 rpm) for 13 minutes for separation of serum.
Urea was estimated according to the Perthelof (1859) methods modified by Potton and Grought (1977). Creatinine was determined for formation of creatinine picric acid complex by the method of Herrony (1969). Uric acid was measured according to the enzymatic colorimetric test methods (uricase-PAP) modified by Trinder (1969).
Statistical analysis
Data was analyzed by T-test by SPSS.
Results
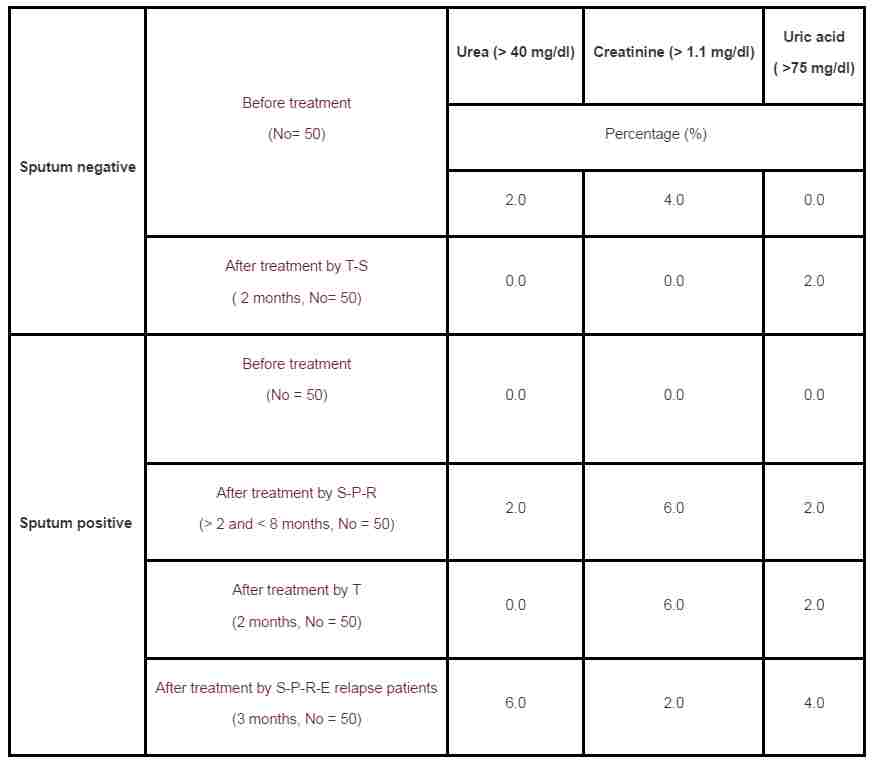
Serum urea concentration of TB patients was not significantly different compared to that of the control group, except for the sputum negative TB patients before treatment, which showed a significantly higher (P < 0.01) urea level. The level of serum urea was significantly (P < 0.01) decreased for sputum negative TB patients after treated with T-S and was slightly decreased in the serum of TB patient of the various treatment, except for those treated with S-P-R-E, which showed a significantly higher level of serum urea (Table 1). 6% of the TB relapsed patients treated with S-P-R-E showed abnormally higher level of urea in their serum (Table 4).
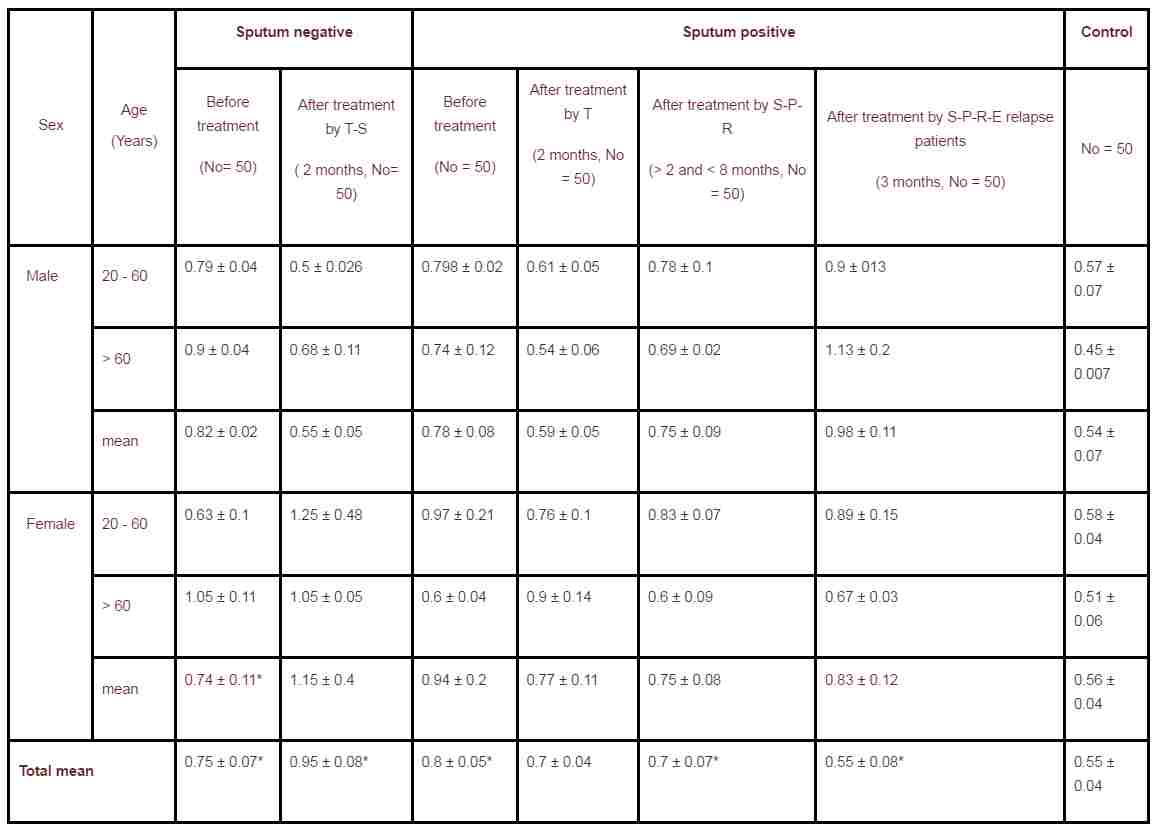
Serum creatinine was significantly higher (p < 0.01) in sputum positive and sputum negative patients before and after treatment relative to that of the control, except for the sputum positive after treatment with S-P-R and T (Table 2). 60% of sputum positive patients treated with Thiazina showed abnormally high creatinine level in their serum (Table 4).
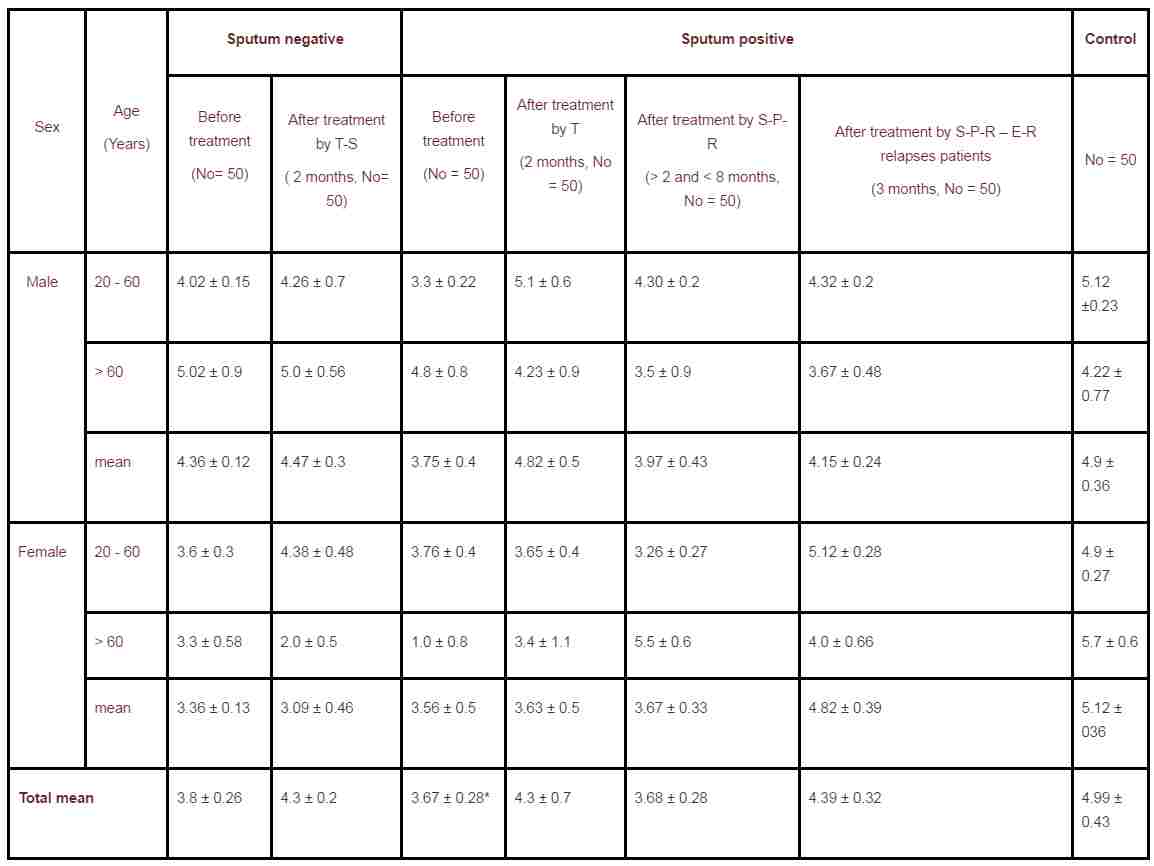
Levels of uric acid in serum of TB patients were lower compared to that of the control (Table 3). 2 - 4% of the TB patients showed abnormally higher uric acid in their serum after the various treatments.
Gender differences was inconsistent for the measured parameter; likewise, the effect of age was not clear.
Table 1. Serum urea concentration (mg/dl) in tuberculosis patients and control subjects (with standard error of the mean).
|
Sex |
Age (Years) |
Sputum negative |
Sputum positive |
Control |
||||
|
Before treatment (No= 50)
|
After treatment by T-S ( 2 months, No= 50) |
Before treatment (No = 50)
|
After treatment by T (2 months, No = 50)
|
After treatment by S-P-R (> 2 and < 8 months, No = 50) |
After treatment by S-P-R-E relapse patients (3 months, No = 50) |
No = 50 |
||
|
Male |
20 - 60 |
35.99 ± 1.63 |
31.17 ± 2.1 |
34.9 ± 1.03 |
30.3 ± 0.9 |
26.79 ± 1.75 |
37.3 ± 0.73 |
37.3 ± 1.45 |
|
> 60 |
40.67 ± 2.9 |
29.6 ± 1.0 |
35.0 ± 3.9 |
37.5 ± 4.8 |
24.78 ± 1.4 |
35.1 ± 4.6 |
29.8 ± 2.0 |
|
|
mean |
37.19 ± 1.96 |
30.72 ± 1.6 |
34.95 ± 1.9 |
32.35 ± 2.21 |
36.12 ± 2.3 |
36.74 ± 1.8 |
35.5 ± 1.58 |
|
|
Female |
20 - 60 |
33. 59 ± 2.40 |
28.3 ± 2.25 |
31.68 ± 3.0 |
30.5 ± 2.4 |
32.05 ± 2.4 |
34.9 ± 4.05 |
30.1 ± 0.77 |
|
> 60 |
34.0 ± 2.9 |
26.67 ± 2.0 |
20.0 ± 1.5 |
20.0 ± 4.5 |
95.20 ± 2.0 |
43.6 ± 2.4 |
29.1 ± 2.3 |
|
|
mean |
33.7 ± 2.6 |
27.93 ± 2.2 |
30.85 ± 2.5 |
29.9 ± 2.4 |
32.6 ± 2.36 |
37.27 ± 3.6 |
29.8 ± 1.2 |
|
|
Total mean |
36.86 ± 1.3* |
29.9 ± 1.3 |
33.39 ± 1.58** |
31.4 ± 1.3 |
31.4 ± 3.8 |
36.85 ± 1.39** |
32.65 ± 0.9 |
|
S = Streptomycin* (significant relative to the control: p < 0.01)
T = Thiazina** (significant relative to before treatment)
E = Ethambutol (p < 0.01)
P = Pyrazinamide
R = Rifampicin
Table 2. Serum creatinine concentration (mg/dl) in tuberculosis patients and control subjects (with standard error of the mean).
|
Sex |
Age (Years) |
Sputum negative | Sputum positive | Control | ||||
| Before
treatment
(No= 50)
|
After
treatment by T-S
( 2 months, No= 50) |
Before
treatment
(No = 50)
|
After
treatment by T
(2 months, No = 50)
|
After
treatment by S-P-R
(> 2 and < 8 months, No = 50) |
After
treatment by S-P-R-E relapse patients
(3 months, No = 50) |
No = 50 | ||
|
Male |
20 - 60 |
0.79 ± 0.04 | 0.5 ± 0.026 | 0.798 ± 0.02 | 0.61 ± 0.05 | 0.78 ± 0.1 | 0.9 ± 013 | 0.57 ± 0.07 |
|
> 60 |
0.9 ± 0.04 | 0.68 ± 0.11 | 0.74 ± 0.12 | 0.54 ± 0.06 | 0.69 ± 0.02 | 1.13 ± 0.2 | 0.45 ± 0.007 | |
|
mean |
0.82 ± 0.02 | 0.55 ± 0.05 | 0.78 ± 0.08 | 0.59 ± 0.05 | 0.75 ± 0.09 | 0.98 ± 0.11 | 0.54 ± 0.07 | |
|
Female |
20 - 60 |
0.63 ± 0.1 | 1.25 ± 0.48 | 0.97 ± 0.21 | 0.76 ± 0.1 | 0.83 ± 0.07 | 0.89 ± 0.15 | 0.58 ± 0.04 |
|
> 60 |
1.05 ± 0.11 | 1.05 ± 0.05 | 0.6 ± 0.04 | 0.9 ± 0.14 | 0.6 ± 0.09 | 0.67 ± 0.03 | 0.51 ± 0.06 | |
|
mean |
0.74 ± 0.11* | 1.15 ± 0.4 | 0.94 ± 0.2 | 0.77 ± 0.11 | 0.75 ± 0.08 | 0.83 ± 0.12 | 0.56 ± 0.04 | |
|
Total mean |
0.75 ± 0.07* | 0.95 ± 0.08* | 0.8 ± 0.05* | 0.7 ± 0.04 | 0.7 ± 0.07* | 0.55 ± 0.08* | 0.55 ± 0.04 | |
S = Streptomycin* (significant relative to the control: p < 0.01)
T = Thiazina** (significant relative to before treatment)
E = Ethambutol (p < 0.01)
P = Pyrazinamide
R = Rifampicin
Table 3. Uric acid concentration (mg/dl) in tuberculosis patients and control subjects (with standard error of the mean).
|
Sex |
Age (Years) |
Sputum negative |
Sputum positive |
Control |
||||
|
Before treatment (No= 50)
|
After treatment by T-S ( 2 months, No= 50) |
Before treatment (No = 50)
|
After treatment by T (2 months, No = 50)
|
After treatment by S-P-R (> 2 and < 8 months, No = 50) |
After treatment by S-P-R – E-R relapses patients (3 months, No = 50) |
No = 50 |
||
|
Male |
20 - 60 |
4.02 ± 0.15 |
4.26 ± 0.7 |
3.3 ± 0.22 |
5.1 ± 0.6 |
4.30 ± 0.2 |
4.32 ± 0.2 |
5.12 ±0.23 |
|
> 60 |
5.02 ± 0.9 |
5.0 ± 0.56 |
4.8 ± 0.8 |
4.23 ± 0.9 |
3.5 ± 0.9 |
3.67 ± 0.48 |
4.22 ± 0.77 |
|
|
mean |
4.36 ± 0.12 |
4.47 ± 0.3 |
3.75 ± 0.4 |
4.82 ± 0.5 |
3.97 ± 0.43 |
4.15 ± 0.24 |
4.9 ± 0.36 |
|
|
Female |
20 - 60 |
3.6 ± 0.3 |
4.38 ± 0.48 |
3.76 ± 0.4 |
3.65 ± 0.4 |
3.26 ± 0.27 |
5.12 ± 0.28 |
4.9 ± 0.27 |
|
> 60 |
3.3 ± 0.58 |
2.0 ± 0.5 |
1.0 ± 0.8 |
3.4 ± 1.1 |
5.5 ± 0.6 |
4.0 ± 0.66 |
5.7 ± 0.6 |
|
|
mean |
3.36 ± 0.13 |
3.09 ± 0.46 |
3.56 ± 0.5 |
3.63 ± 0.5 |
3.67 ± 0.33 |
4.82 ± 0.39 |
5.12 ± 036 |
|
|
Total mean |
3.8 ± 0.26 |
4.3 ± 0.2 |
3.67 ± 0.28* |
4.3 ± 0.7 |
3.68 ± 0.28 |
4.39 ± 0.32 |
4.99 ± 0.43 |
|
Table 4. Percentage of TB patients with abnormally high urea, creatinine and uric acid.
|
Sputum negative |
Before treatment (No= 50) |
Urea (> 40 mg/dl) |
Creatinine (> 1.1 mg/dl) |
Uric acid ( >75 mg/dl) |
|
Percentage (%) |
||||
|
2.0 |
4.0 |
0.0 |
||
|
After treatment by T-S ( 2 months, No= 50) |
0.0 |
0.0 |
2.0 |
|
|
Sputum positive |
Before treatment (No = 50)
|
0.0 |
0.0 |
0.0 |
|
After treatment by S-P-R (> 2 and < 8 months, No = 50) |
2.0 |
6.0 |
2.0 |
|
|
After treatment by T (2 months, No = 50) |
0.0 |
6.0 |
2.0 |
|
|
After treatment by S-P-R-E relapse patients (3 months, No = 50) |
6.0 |
2.0 |
4.0 |
|
S = Streptomycin
T = Thiazina
E = Ethambutol
P = Pyrazinamide
R = Rifampicin
Discussion
Urate is primarily produced in tissues containing xanthene oxidase like liver and small intestine. At any time, the amount of the urate in body is due to the balance between the amount produced and amount excreted. Kidneys are the main organs of excretion of protein metabolites as uric acid. There are four components in renal homeostasis: glomerular filtration, tubular reabsorption, secretion and post-secretion reabsorption Approximately 8 to 12% of protein metabolites filtrated by the glomeruli is excreted in the urine as uric acid, urea and creatinine. After filtration, 98 to 100% of the urea, creatinine and uric acid is reabsorbed, about half the reabsorbed protein metabolites is secreted back into the proximal tubule and about 40% of that is again reabsorbed.
The present study shows that the anti-tuberculosis drugs increase the levels of uric acid and creatinine but decrease the level of urea. It also shows that the results returned back to normal once the drug was stopped. Similar findings have been reported form many countries (Adebisi et al., 2000). Concerning the Pyrazinamide effects upon urate, urea, creatinine, it was reported from Nigeria that, among patients taking anti-tuberculosis therapy with Pyrazinamide, 51.6% developed hyperuricemia that returned back to normal when Pyrazinamide and other anti-tuberculosis drugs were withdrawn after 8 weeks (Adebisi et al., 2000). Similar findings are reported in pediatric patients suffering from tuberculosis. Significant increase in uric acid mean concentration after one month of therapy with Pyrazinamide (from 3.7 ± 0.7 mg/dl to 5.7 ± 1.6 mg/dl, P < 0.05) was observed, falling again to 4.0 ± 1.1 one month after Pyrazinamide was stopped. There were no signs of clinical gout or arthralgias. No case of treatment interruption (Sanchez et al., 1997).
Conclusion
We concluded that although the anti-tuberculosis agents, associated with the treatment of pulmonary tuberculosis, induced the changes of protein metabolites, such changes have no detectable negative effect on the renal function of the patients.
References
1. Bass, J. B., Farer, L. S., Hopewell, P. C., O'Brien, R., Jacobs, R. F., Ruben, F., ... & Thornton, G. (1994). Treatment of tuberculosis and tuberculosis infection in adults and children. American Thoracic Society and The Centers for Disease Control and Prevention. American journal of respiratory and critical care medicine, 149(5), 1359-1374. FIND ONLINE
2. Espinal, M. A., Kim, S. J., Suarez, P. G., Kam, K. M., Khomenko, A. G., Migliori, G. B., ... & Raviglione, M. C. (2000). Standard short-course chemotherapy for drug-resistant tuberculosis. JAMA: the journal of the American Medical Association, 283(19), 2537.FIND ONLINE
3. Fatal and Severe hepatitis associated with rifampin and pyrazinamide for treatment of latent tuberculosis infection. New York and Georgia (2001). CDC - MMWR Morbidity and Mortality Weekly Report, 50: 289-291.FIND ONLINE
4. Mavromatidis, K., Magoula, I., & Tsapas, G. (2002). Urate homeostasis in polycystic kidney disease: comparison with chronic glomerulonephritic kidney. Renal failure, 24(4), 447-459. FIND ONLINE
5. Adebisi, S.A., Oluboyo, P.O. and Okesina, A.B. (2000). Effect of drug-induced hyperuricemia on renal function in Nigerians with pulmonary tuberculosis. African Journal of Medicine and Medical Sciences, 29: 297-300. FIND ONLINE
6. Sanchez-Albisua, I., Vidal, M. L., Joya-Verde, G., Del Castillo, F., De Jose, M. I., & Garcia-Hortelano, J. (1997). Tolerance of pyrazinamide in short course chemotherapy for pulmonary tuberculosis in children. Pediatric Infectious Disease Journal, 16(8), 760-763. FIND ONLINE
7. Friden, T.R., Sterling, T.R.,Munsiff, S.S., Watt, C.J. and Dye, C. (2003). Tuberculosis. Lancet, 362: 887-899. FIND ONLINE
8. Schluger, N. W., Harkin, T. J., & Rom, W. N. (1996). Principles of therapy of tuberculosis in the modern era. Tuberculosis, 1, 751-761.
Cite this paper
APA
Abdoon, G. T., Elsheikh, O. M., Osman, E. A., Eljamal, A. A., Modawe, G., Elmarouf, M. A., Omer, A. A., et al. (2012). Influence of Antimycobacterial Agents on Renal Biochemical Parameters of Tuberculosis Patients. Open Science Repository Pharmaceutics, Online(open-access), e70081913. doi:10.7392/Pharmaceutics.70081913
MLA
Abdoon, G. T. et al. “Influence of Antimycobacterial Agents on Renal Biochemical Parameters of Tuberculosis Patients.” Open Science Repository Pharmaceutics Online.open-access (2012): e70081913.
Chicago
Abdoon, G. T., O. M. Elsheikh, E. A. Osman, A. A. Eljamal, G. Modawe, M. A. Elmarouf, A. A. Omer, and M. M. Dahab. “Influence of Antimycobacterial Agents on Renal Biochemical Parameters of Tuberculosis Patients.” Open Science Repository Pharmaceutics Online, no. open-access: e70081913. http://www.open-science-repository.com/influence-of-antimycobacterial-agents-on-renal-biochemical-parameters-of-tuberculosis-patients.html.
Harvard
Abdoon, G.T. et al., 2012. Influence of Antimycobacterial Agents on Renal Biochemical Parameters of Tuberculosis Patients. Open Science Repository Pharmaceutics, Online(open-access), p.e70081913. Available at: http://www.open-science-repository.com/influence-of-antimycobacterial-agents-on-renal-biochemical-parameters-of-tuberculosis-patients.html.
Nature
1. Abdoon, G. T. et al. Influence of Antimycobacterial Agents on Renal Biochemical Parameters of Tuberculosis Patients. Open Science Repository Pharmaceutics Online, e70081913 (2012).
Science
1. G. T. Abdoon et al., Influence of Antimycobacterial Agents on Renal Biochemical Parameters of Tuberculosis Patients, Open Science Repository Pharmaceutics Online, e70081913 (2012).
doi
Research registered in the DOI resolution system as: 10.7392/Pharmaceutics.70081913 .
Open reviews for this paper
Click below to see contributions from reviewers of this page.
Influence of Antimycobacterial Agents on Renal Biochemical Parameters of Tuberculosis Patients - Work Problem Not rated yet
This paper sheds a light on the following problem:
Do these anti-tuberculosis drugs affect renal function, as shown by renal biochemical parameters? …

This work is licensed under a Creative Commons Attribution 3.0 Unported License.
We are looking for partners to help us develop this open access project further. Write to [email protected].
"I may be wrong and you may be right, and by an effort we may get nearer to the truth." Karl Popper
Export to Mendeley
|
Click on this icon. You'll need to log in. |

|